I mentioned previously that I used QGIS to draw lines in the direction of slope, where I had a segmented layerstack which included elevation, slope, aspect and 2 curvature layers (longitudinal and cross-sectional). This was done with
RSGISlib in a similar way to my Mars work.
There was an
bug with QGIS 2.12 that meant the plotting of arrows didn't work but with QGIS 2.12.1 this seems to be working again. It still takes a long time to render with the SVG marker, even with 32GB RAM and a quad-core system.
Here are a few examples:
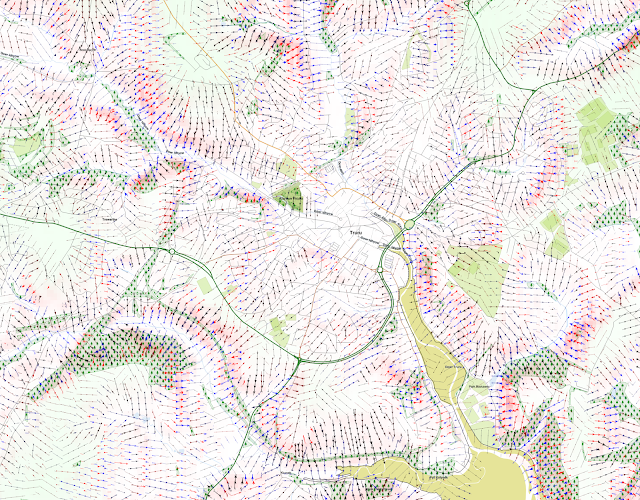 |
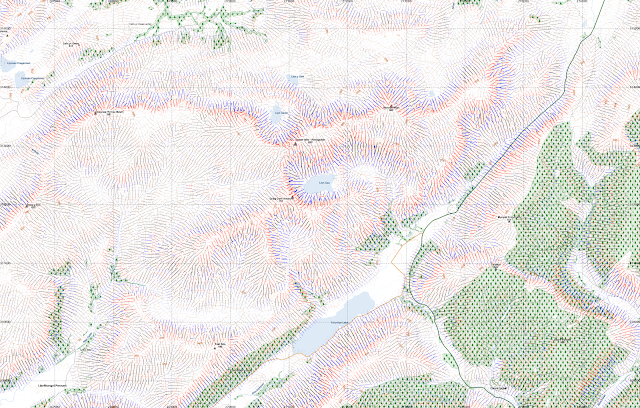
| Truro area in Cornwall. The slopes are marked with arrowed lines, with steeper slopes marked more thickly, and red for convex, and blue for concave slopes. |
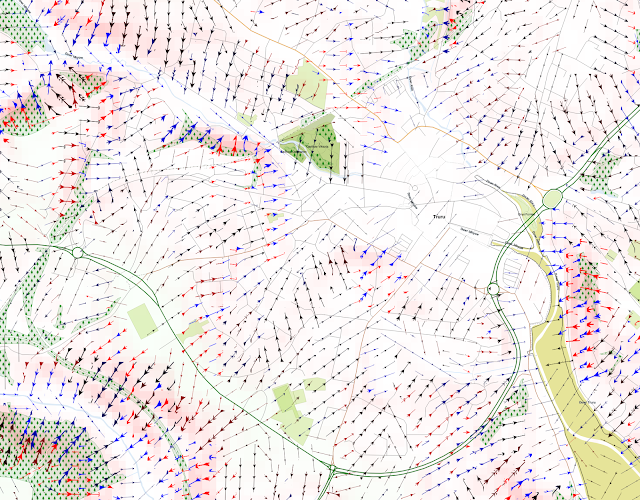 |
| A closer zoom into the city. |
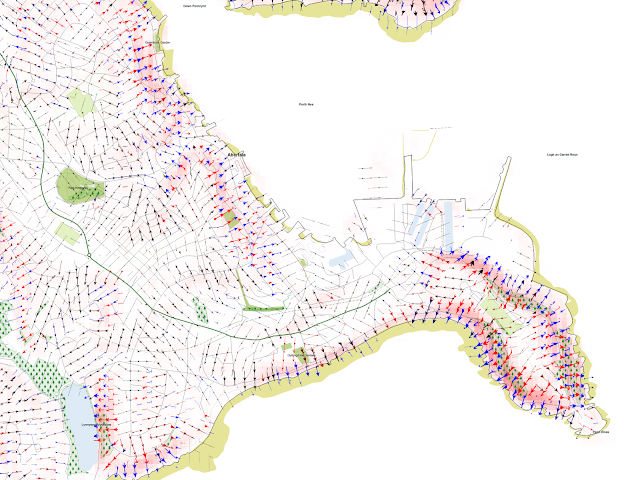 |
| Around Falmouth, including Pendennis Head |
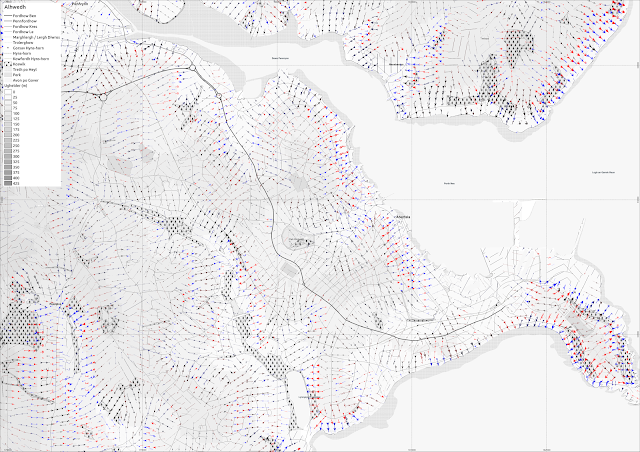 |
| Falmouth again, with grayscale elevation. |
Aberystwyth, Ceredigion, Wales:
I show here several QGIS screenshots, at 1:10000 or larger scale, since the rendering of the arrows becomes very slow beyond 1:10000
.
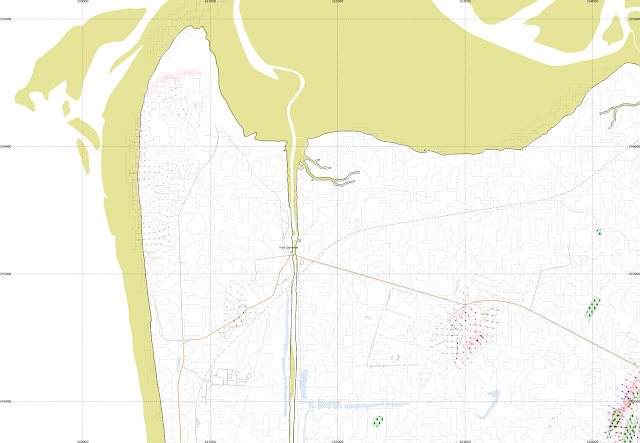 |
| Ynys Las and part of Borth Bog (Cors Fochno). This is mainly a flat area so most segments do not have lines shown. |
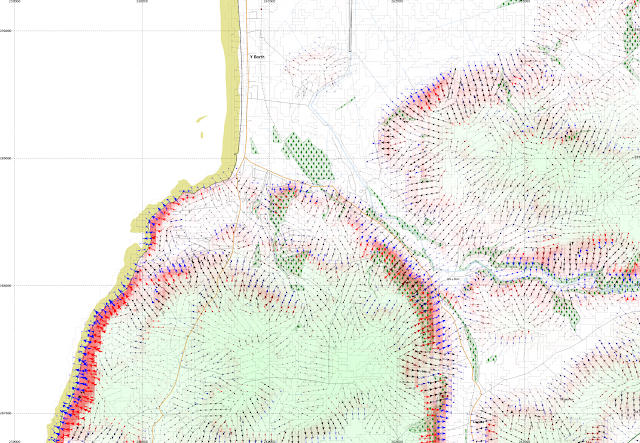 |
| Borth itself, a little to the south |
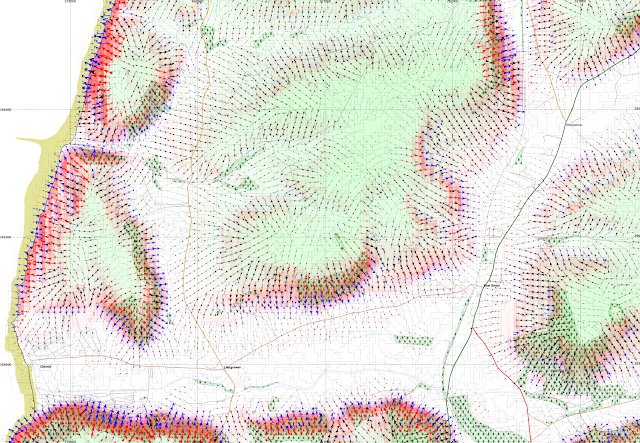 |
| Clarach Bay, and Wallog, and Bow Street |
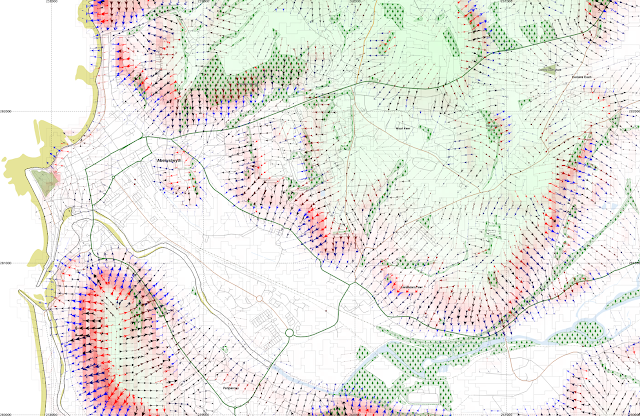 |
| Aberystwyth town and main university campus are here shown, along with Pendinas hillfort, Penparcau, and Llanbadarn Fawr. |
Cadair Idris - a textbook glacial landscape
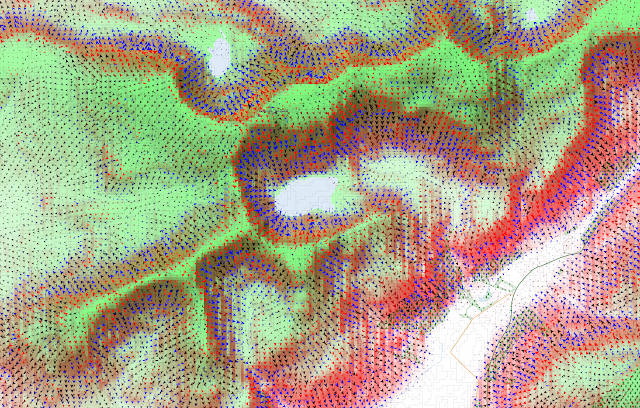 |
| Showing the arrows downslope only. |
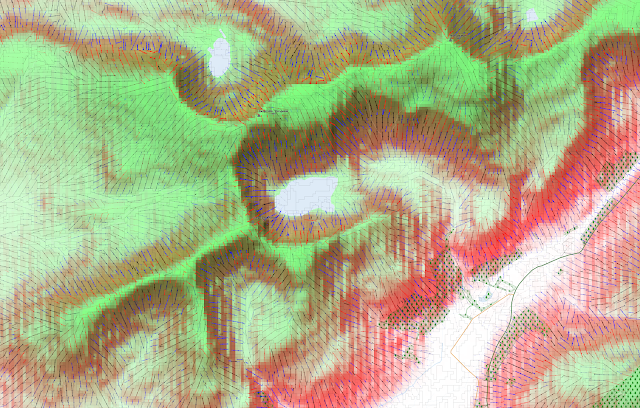 |
| Adding in the slope parallell lines but making the arrowheads smaller. |
 |
| At 1:20000 this takes a long time to render on the map canvas in QGIS. |
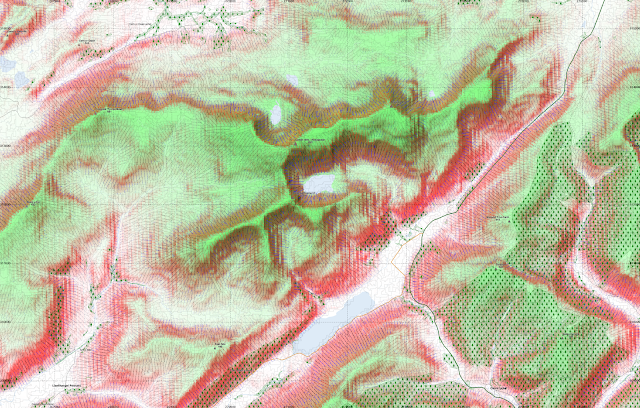
 |
| A version with only the lines renders much faster. |
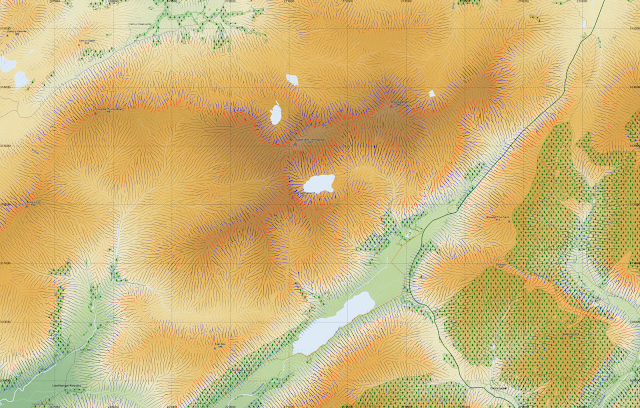
 |
| Using contours instead of shading to indicate elevation. |


No comments:
Post a Comment